

Mag-apply para sa Live
Account
AcademyMga Partners

A popular trading strategy among forex traders is identifying supply and demand zones. However, not many traders are well-versed in this area; many fail to recognize the subtle signs that help determine an area’s strength.
Supply and demand are grounded in technical analysis, specifically price action. Traders look for robust areas that form a strong climb or decline.
A demand zone is an area in the price chart that, when reached, sees buyers' desires beginning to exceed sellers' desires. In other words, the buy volume becomes higher than the sell volume. At this point, the price stops falling, and an incline begins. The support zone operates oppositely.
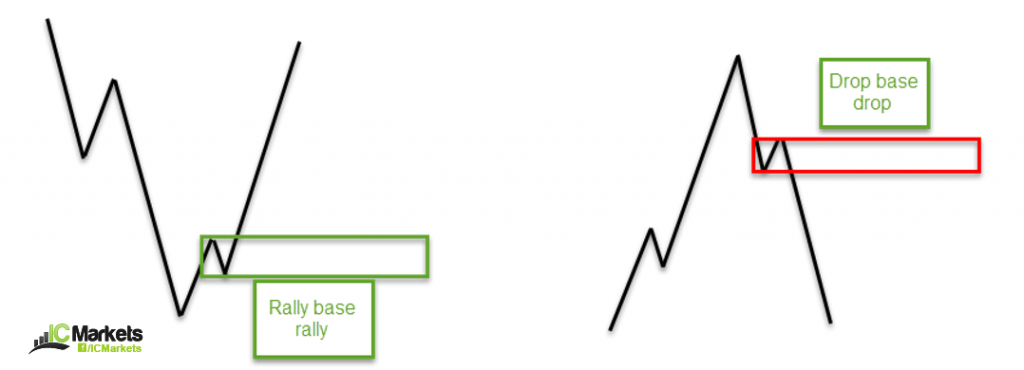
The four key areas of interest are illustrated below:
A rally base rally zone usually forms in an uptrend, though it can also be seen at the start of trends.
A drop-base drop supply zone is similar to a rally-base rally zone, except it forms during a downtrend or at the beginning of a trend.
A drop base rally demand is a zone usually denoting a bottom.
A rally-based drop supply forms similarly to a drop-based rally; the only difference is that the pattern prints a market top and follows through with a move lower.
There’s no definite answer to this question. According to studies, support and resistance are lines that have held a price in history and may do so again in the future. Supply and demand, on the other hand, involves a recent move and an untouched base. The base is what attracts traders. Tools like Fibonacci retracements can help frame where these zones might align with pullbacks.
Momentum
Supply and demand areas with good momentum that engulf nearby highs/lows are positive indicators. These traits signal that prices moved with little opposition. Momentum context can be cross-checked with indicators like RSI or MACD.
Healthy momentum out of the base is needed as it informs traders of areas with high potential. In practice, you might filter for setups that offer a favorable risk-reward ratio.
Duration
How long the price stays away from a supply or demand area is also crucial.
There’s a belief that supply and demand zones work as institutional traders leave unfilled orders at the base of these areas, but it’s unlikely that traders would leave orders in the market for that long.
However, research has shown that areas where the price moves quickly from its zone appear to be the higher-probability frameworks for trading.
Fresh
To consider a supply or demand area “fresh”, it needs to meet two conditions: zone forms without other structures' help and cannot form from a reaction to another zone.
Trading according to the market trend is advantageous; traders must consider the market's reversal pattern. Just because a trend forms on the H1 doesn’t mean the daily timeframe will have a similar trend. If the daily timeframes, H1 and H4, show a comparable trend, the likelihood of a successful trade from an H1 supply or demand area increases. For a structured workflow, consider a top-down analysis checklist.
Traders should also utilize multi-time frame analysis. Though trading short from a supply zone may seem great, if the higher-timeframe structure poses an obstacle, traders may sell into a daily demand area. The bigger picture is important for trend and structure.
When used correctly, traders can benefit greatly from utilizing supply and demand in their strategy. Here are some additional points to confirm the validity of an area:
Trend line convergence. If the trend line meets your chosen zone, the chance of a bounce increases. Review how to draw and validate them with our guide to trading with trend lines.
Is there a long-term support/resistance level intersecting with the area? Pair zone selection with your broader trading strategy and position sizing via the trading calculator.
If you want to put your newfound knowledge to use, try a demo account. You can also practice identifying zones on MT4 or MT5.


Telepono: +61 2 8036 8388
Fax: +61 2 8036 8388
Email: support@tmgm.com
Web: https://www.tmgm.com


Ang impormasyong ibinigay sa website na ito ay pangkalahatang kalikasan lamang at hindi bumubuo ng personal na payo sa pananalapi. Bago kumilos sa anumang impormasyon sa website na ito, dapat mong isaalang-alang ang pagiging angkop ng impormasyon kaugnay ng inyong mga layunin, sitwasyong pananalapi at mga pangangailangan. Ang pamumuhunan sa mga CFD at FX Margin Contract ay may malaking panganib at hindi angkop para sa lahat ng mga mamumuhunan. Maaari kayong mawalan ng higit pa sa inyong paunang deposito. Hindi kayo may-ari, o may, anumang interes sa pinagbabatayan na asset. Inirerekomenda namin na humingi kayo ng independiyenteng payo at tiyakin na lubos ninyong nauunawaan ang mga panganib na kasangkot bago mag-trading. Mahalagang basahin at isaalang-alang ninyo ang disclosure document bago makakuha ng anumang produktong nakalista sa website. Ang mga impormasyon at advertisement na inaalok sa website na ito ay hindi inilaan para sa paggamit ng sinumang tao sa anumang bansa o hurisdiksyon kung saan ang naturang paggamit ay salungat sa mga lokal na batas at regulasyon. Ang mga Produkto at Serbisyong inaalok sa website na ito ay hindi inilaan para sa mga residente ng Estados Unidos.
Ang TMGM ay awtorisado at pinangangasiwaan sa iba't ibang hurisdiksyon.
Ang Trademax Australia Limited, na nag-trading bilang TMGM, ay pinangangasiwaan ng Australian Securities and Investments Commission (ASIC), AFSL no. 436416 at matatagpuan sa Level 28, One International Tower, 100 Barangaroo Avenue, 2000 Sydney, NSW Australia.
Email: support@tmgm.com.au
Ang Trademax Global Limited, na nag-trading bilang TMGM, ay awtorisado at pinangangasiwaan ng Vanuatu Financial Services Commission (VFSC), registration number 40356 at nakarehistro sa 1276, Kumul Highway, Port Vila, Vanuatu, Republic of Vanuatu.
Email: support@tmgm.com
Ang Trademax Global Markets (SE) Limited, na kilala bilang TMGM, ay awtorisado at nire-regulahan ng Financial Services Authority (FSA) ng Seychelles, na may lisensya bilang SD224. Ang kumpanya ay nakarehistro sa Office Blg. 13, Providence Estate ABIS Centre, Mahe, Seychelles.
Email: support@tmgm.com
Ang Trademax Global Markets (International) Pty Ltd, na nag-trading bilang TMGM, ay awtorisado at pinangangasiwaan ng Financial Services Commission, Mauritius (FSC) na may license no. GB22201012, at nakarehistro sa 33, Edith Cavell Street C/o IQ EQ Fund Services (Mauritius) Ltd Port Louis, 11324 Mauritius.
Email: support@tmgm.com
Copyright © TMGM. Lahat ng karapatan ay nakalaan
