
Apply for a Live
Account
AcademyPartners
Swing trading is a widely adopted trading strategy for traders looking for a less demanding approach. It targets medium-term market fluctuations without the high frequency of day trading. By concentrating on price swings spanning several days to weeks, traders engage with broader market trends rather than rapid transactions. This approach enables traders to leverage market trends while minimizing screen time, making it ideal for individuals with other obligations or those new to trading.
Key Takeaways
What Is Swing Trading? Swing Trading Explained
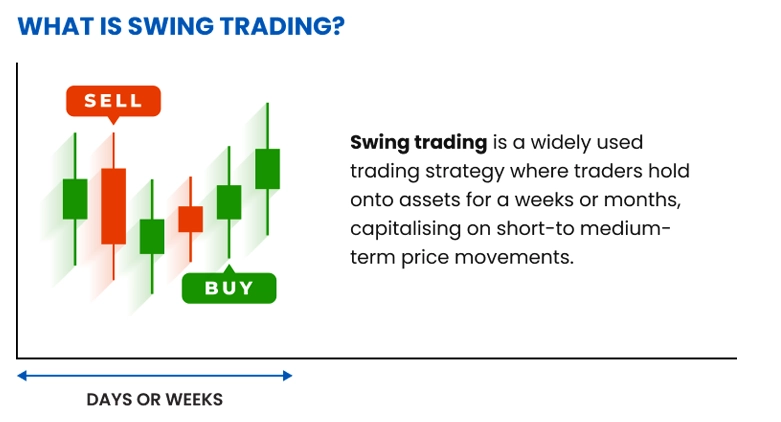
Figure 1: Illustrates swing trading as a strategy where traders hold positions for days, weeks, or months to profit from short- to medium-term price fluctuations
Swing trading is a trading style designed to capture gains over several days to weeks. Unlike day trading, which involves opening and closing positions within the same trading day, swing trading permits holding positions overnight and through weekends. However, unlike position trading or investing, it does not involve holding assets for months or years.
The optimal timeframe for swing trades ranges from 2 days up to several weeks. This approach suits traders who cannot monitor markets continuously but want to benefit from market swings while filtering out intraday noise.
Swing traders capitalize on trend momentum—often capturing 20-30% moves—for a substantial portion of the trend duration, rather than just brief segments. These price swings typically unfold in waves, including consolidations and retracements.
Successful swing trading demands a balanced psychological approach, akin to the discipline required in margin trading. Traders must exercise patience to allow trades to develop per their analysis and discipline to take profits or cut losses at predetermined levels.
Swing trading’s psychological advantage lies in reducing the pressure for split-second decisions. With more time to analyze setups and manage positions, traders maintain clearer judgment and avoid emotional pitfalls common in day trading, such as revenge trading or overtrading.
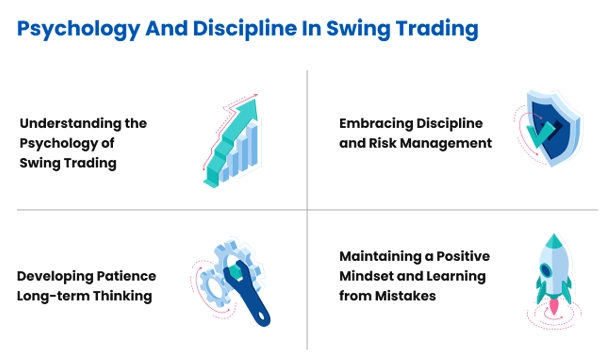
Figure 2: Highlights essential psychological and discipline factors for successful swing trading
To better understand swing trading, it is useful to compare it with other popular trading styles:
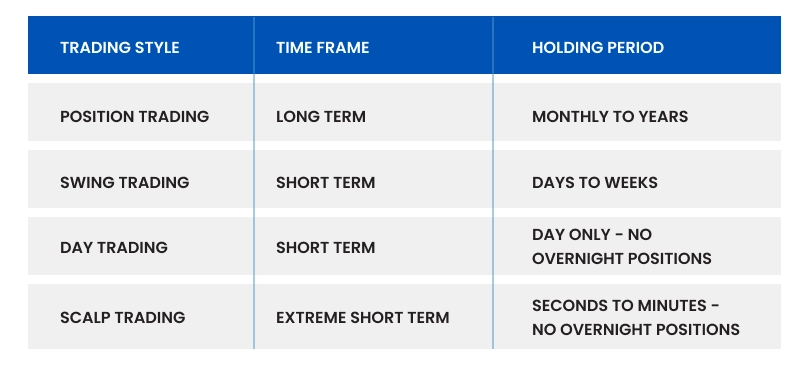
Figure 2: Side-by-side comparison of trading styles, monitoring requirements, capital allocation, and market approaches
Day traders open and close positions within the same trading day
Swing traders hold positions for days or weeks
Day trading requires continuous market monitoring; swing trading requires periodic checks
Day traders typically use 1-minute to 1-hour charts; swing traders use 4-hour to daily charts
Position Trading vs Swing Trading:
Position traders hold trades for months or years
Swing traders exit once the swing completes (days to weeks)
Position traders emphasize fundamental analysis; swing traders rely more on technical analysis
Position trading requires less frequent monitoring than swing trading
Scalping vs Swing Trading:
Scalpers aim for very small price moves, holding positions for seconds to minutes
Swing traders target larger market moves
Scalpers execute dozens of trades daily; swing traders take fewer, more selective trades
Scalping demands intense focus and specialized execution tools; swing trading can be performed on standard platforms
1. Time Efficiency
Swing trading demands less time commitment than day trading. The original document notes that "swing traders can achieve returns comparable to day traders with significantly less screen time. Since trades unfold over days, traders are not required to monitor every tick." This efficiency suits those balancing trading with other responsibilities, promoting better work-life balance and reducing burnout risk common among day traders.
2. Reduced Risk of Overtrading
With less screen time, swing traders are less prone to overtrading. The source states, "because swing traders spend less time watching markets, they are less tempted to overtrade. Day traders often think through trades all day and may take suboptimal trades just to remain active.'" This psychological edge supports discipline and prevents emotionally driven losses.
3. Lower Transaction Costs
Swing traders execute fewer trades, resulting in lower commissions and reduced slippage compared to higher-frequency styles. The source confirms, "swing traders pay fewer commissions, fees, and experience less slippage, which has less impact due to larger per-trade profits." Over time, these savings enhance overall profitability, especially for smaller accounts.
4. Improved Work–Life Balance
Unlike day trading, which can consume entire days, swing trading allows for a more balanced lifestyle. Traders can maintain full-time jobs, spend time with family, or pursue other interests while still actively participating in the markets. This sustainability makes swing trading a viable long-term approach for many traders.
5. Captures Significant Market Moves
Swing trading aims to capture substantial price movements. As noted, "while day traders often capture only a segment of a larger move, swing traders attempt to capture entire legs or swings up or down." This enables traders to benefit from the core of price trends rather than small fragments.
1. Overnight Risk Exposure
Swing traders face overnight and weekend risk, including gap openings caused by unexpected news when markets are closed. The source highlights, "those trading during the Coronavirus pandemic understand the severity of overnight risk on both long and short positions. Swing traders cannot fully mitigate overnight risk, especially in individual stocks, whereas day traders can close positions quickly." This risk necessitates additional risk management and can result in losses exceeding stop-loss levels.
2. Missing Intraday Opportunities
While day traders capitalize on multiple intraday opportunities, swing traders may miss these short-term moves. Market “trend days”——sessions with sustained, high-conviction directional moves——occur regularly. During such periods, swing traders aligned with the trend capture sizable gains, while day traders exploit multiple intraday setups like scalping and momentum trading. This means swing traders may miss profitable short-term trades that do not develop into larger trends.
3. Requires Patience and Discipline
Swing trading requires patience to allow trades to evolve over days or weeks, which can be difficult for traders used to immediate feedback from day trading. Managing drawdowns and waiting for targets demands strong emotional discipline.
4. Capital Tied Up Longer
Since positions are held longer, capital is committed to fewer trades at a time. This reduces capital efficiency and may limit new opportunities, particularly for traders with smaller accounts who cannot enter new trades while existing ones are active.
5. Market Environment Sensitivity
Swing trading strategies perform variably across market conditions. Trend-following methods excel in trending markets but may produce false signals in choppy, range-bound environments. Adaptability is crucial, as strategies effective in past regimes may underperform in new ones.
The bull flag is among the most reliable chart patterns for swing traders' within swing trading strategies. As the name implies, the pattern resembles a flag on a pole on the chart. It represents a brief consolidation in a strong uptrend, offering traders an entry point before the next upward leg.
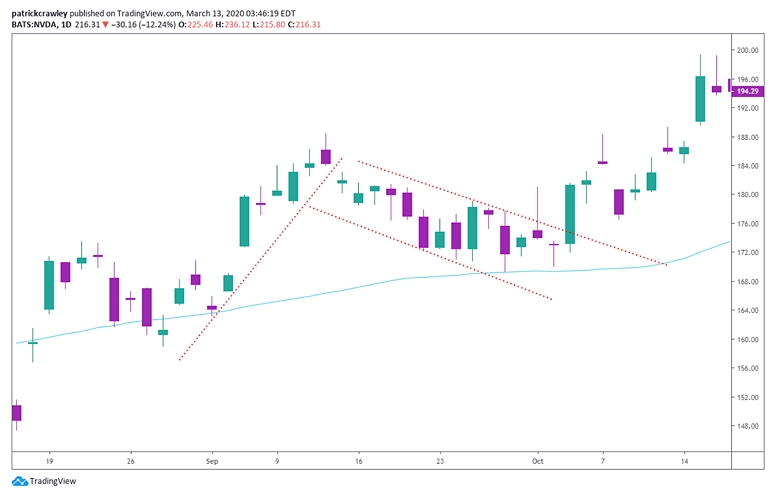
Figure 2: Candlestick chart from TradingView illustrating a bull flag, a common continuation pattern in swing trading
common continuation pattern used in swing trading
A sharp upward move (flagpole) on high volume, often a 30-100% price increase
A consolidation phase with a slight downward drift (the flag), typically retracing 33% to 50% of the flagpole
Lower volume during consolidation (ideally 50% or less of the flagpole volume)
A breakout above the flag signals entry
The pattern usually forms over 1-4 weeks
The source notes, "a bull flag is a trend pullback setup named for its flag-like shape. It is a conservative pattern with high odds of continuation, typically representing a retracement of the recent swing high.''"
Trading the Bull Flag Pattern:
Identify Setup: Look for a strong upward move followed by consolidation
Confirm Volume: High volume on the flagpole, lower volume during the flag
Entry: Enter on breakout above the flag’s upper trendline with increased volume
Stop Loss: Place stop loss below the flag’s lowest point
Target: Measure the flagpole’s length and project it from the breakout point
The document emphasizes, "successful bull flags share these traits: a sharp impulse move on high volume forming the flagpole; a moderate pullback less aggressive than the initial rise; and a breakout signaling a long entry.'"
Optimal bull flag setups often occur in:
Stocks with recent strong earnings surprises (20%+ beats)
Leading stocks in strong sectors outperforming peers by 10%+
Market leaders like Apple or Microsoft during recent bull markets
Stocks making new 52-week highs
Hundreds of bull flag patterns emerge daily; focusing on high-probability setups is essential. The most profitable combine strong volume and momentum during the initial surge with muted volume during pullbacks. To refine your strategy, prioritize:
Stocks with significant earnings beats
Companies in leading sectors outperforming peers
Market leaders— such as tech giants Apple and Microsoft
Support and resistance levels provide excellent entry points for swing traders, especially when trading with the prevailing trend. These psychological price zones mark areas where buying or selling pressure previously halted price movements.
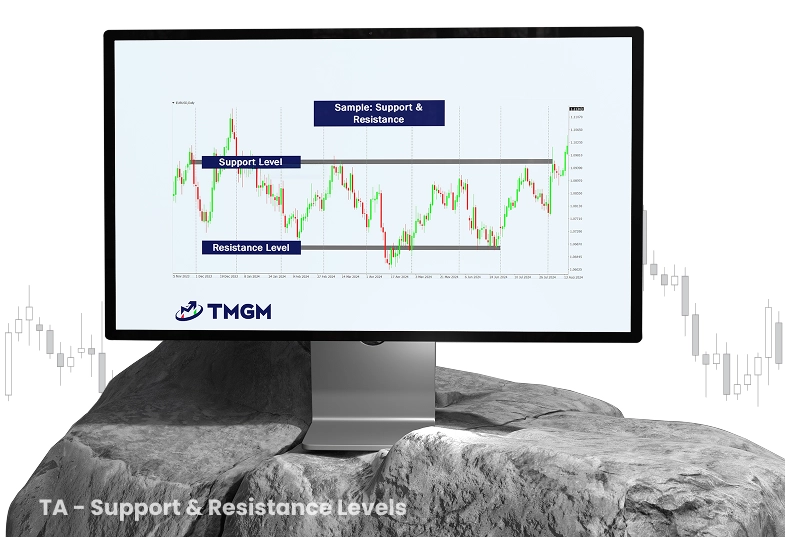
Figure 3: Illustrates support and resistance levels, key technical analysis concepts aiding entry and exit decisions
Types of Support and Resistance:
Horizontal Support & and Resistance Levels: Price levels where the market has repeatedly reversed
Dynamic Support & and Resistance Lines: Moving averages acting as dynamic support or resistance
Psychological Price Levels: Round numbers (e.g., $50, $100) influencing trader behavior
Fibonacci Retracement Levels: Mathematically derived retracement levels based on prior price moves
Prerequisites for Effective Support/Resistance Trading:
The asset should be in a clear trend (uptrend for buying at support, downtrend for selling at resistance)
Support or resistance levels must be well-defined with multiple tests
Volume should confirm the level’s significance (higher volume on bounces)'
Implementation Tips:
Focus on leading stocks in leading sectors
Look for stocks making higher highs and higher lows (for uptrends)
Monitor momentum indicators – avoid buying when momentum declines
Consider buy stops above range highs after low-momentum pullbacks to support
The more times a level is tested, the stronger it becomes
Look for confluence of multiple support/resistance factors at the same price
Risk Management Tips:
Enter trades near support (in uptrends) or resistance (in downtrends)
Place stop losses beyond support/resistance levels (allowing some "wiggle room")
Take partial profits at the next resistance level (when buying at support)
Moving average crossovers are a core swing trading strategy to detect momentum shifts and trend changes. This method uses two or more moving averages of different periods to generate buy and sell signals.
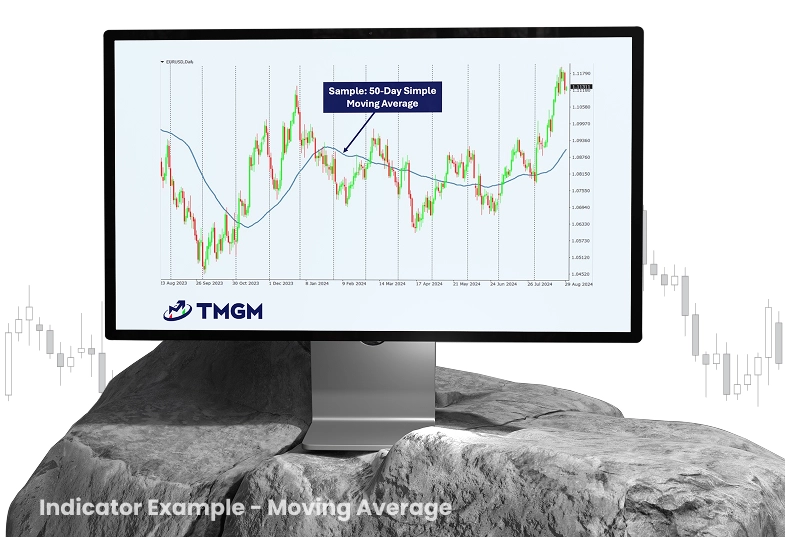
Figure 4: Displays the 50-day Simple Moving Average (SMA), a widely used trend-following indicator
Popular Moving Average Pairs:
10 and 20-day EMAs (fast crossover)
20 and 50-day EMAs (medium-term signals)
50 and 200-day SMAs (the well-known "Golden Cross" and "Death Cross")
Trading Rules:
Buy Signal: When the shorter-term MA crosses above the longer-term MA
Sell Signal: When the shorter-term MA crosses below the longer-term MA
Confirmation: Look for volume increase and confirming candlestick patterns
Advanced Swing Trading Techniques:
Use three moving averages (e.g., 5, 10, and 20-day) for stronger confirmation
Add a longer-term MA (e.g., 200-day) to identify the primary trend
Watch for moving average "compression" (convergence) before breakout moves
Fibonacci retracement levels assist swing traders in identifying potential reversal points during corrections. These levels (23.6%, 38.2%, 50%, 61.8%, 78.6%) are derived from the Fibonacci sequence and often act as support or resistance.
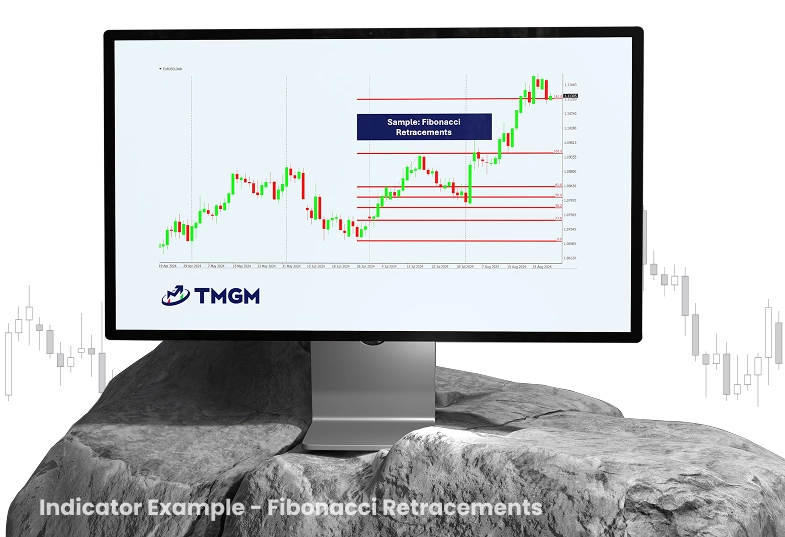
Figure 5: Illustrates Fibonacci retracement levels, a popular technical tool for identifying support and resistance zones
How to Use Fibonacci Retracements:
Identify a significant price move (swing low to swing high for uptrends)
Draw the Fibonacci retracement from the start to the end of the move
Observe price reactions at key retracement levels
Enter trades when price bounces off retracement levels in the trend direction
Best Practices:
The 38.2% and 61.8% levels are often the most reliable
Seek confluence with other indicators (moving averages, trendlines)
Confirm reversals with candlestick patterns at retracement levels
Combine with momentum indicators to assess retracement strength
Breakout trading involves entering positions when price breaks key support or resistance, leveraging the momentum that typically follows. This strategy suits volatile markets where consolidations precede strong directional moves.
Common breakout formations include:
Rectangle Patterns: Price moves within a horizontal range before breaking out
Triangle Patterns: Ascending, descending, or symmetrical triangles indicating potential breakouts aligned with the trend
Head and Shoulders: Bearish reversal pattern signaling potential downward breakout
Cup and Handle: Bullish continuation pattern often leading to upside breakout
To trade breakouts effectively, traders should:
Identify a well-defined consolidation with a clear breakout level
Monitor volume for confirmation of momentum
Enter trades upon decisive price break of resistance (longs) or support (shorts)
Place stop-loss orders just below breakout level (for longs) to limit risk
Set profit targets at next resistance or by measuring prior price range
False breakouts occur when price briefly breaches a key level then reverses. To reduce risk:
Wait for confirmation with a close beyond breakout level
Confirm breakout strength with above-average volume’
Apply the 2% rule: price should move at least 2% beyond breakout before entering
Trade in the direction of the broader market trend
Combining technical confirmation with disciplined risk management enhances breakout trading success and reduces common errors.
Effective risk management is vital for long-term swing trading success. Even the best strategies incur losses; protecting capital during drawdowns distinguishes successful traders from those who deplete their accounts.
Position sizing determines capital allocation per trade and is a critical risk management component.
Key Position Sizing Methods:
Fixed-Percentage Risk Model: Risk a fixed percentage (commonly 1-2%) of total capital per trade
Volatility-Based Position Sizing: Adjust size based on instrument volatility (smaller positions for higher volatility)
Tiered Position Sizing: Allocate different percentages based on conviction (e.g., 0.5% moderate, 1% high conviction)
Example: With a $10,000 account risking 1% per trade:
Maximum risk per trade = $100
If stop loss is $0.50 away, buy 200 shares ($100 ÷ $0.50)
Adjust position sizes as account value changes
Stop losses protect capital by automatically exiting trades when price moves unfavorably beyond a set point.
Effective Stop Loss Placement:
Technical Stops: Place stops below key support (longs) or above resistance (shorts)
Volatility-Based Stops: Use Average True Range (ATR) to set stops (e.g., 2 × ATR below entry)
Time-Based Stops: Exit trades not performing within a set timeframe
Stop-Loss Best Practices:
Effective stop-loss management controls risk and improves trade consistency. Best practices include:
Set stops at trade entry to enforce discipline and avoid emotional decisions
Avoid obvious stop levels vulnerable to stop hunts; place stops slightly beyond these levels
Use mental stops in highly volatile markets to avoid premature exits, requiring strong discipline and monitoring
Never move stops further away; adjust only to lock in profits, not to increase risk
Following these practices helps maintain structured risk management and adapt to market conditions.
Predefined profit targets promote discipline and prevent emotional errors in managing winning trades.
Profit Target Methods:
Technical Chart Levels: Exit at key resistance (longs) or support (shorts) levels
Risk-Reward Ratio: Set targets at 2:1 or 3:1 reward-to-risk distances
Trailing Stops: Use trailing stops to lock in profits while letting winners run (e.g., 2 × ATR trailing stop)
Partial Profit-Taking: Scale out of positions by taking partial profits at multiple levels
While price action forms the analysis foundation, technical indicators provide valuable insights for swing trading decisions.
Volume confirms price moves and reveals trend and reversal strength.
Key Volume Indicators:
Volume Bars: Basic volume showing trading activity
On-Balance Volume (OBV): Cumulative volume indicator adding or subtracting volume based on price direction
Volume Profile: Displays volume distribution across price levels
Chaikin Money Flow: Measures buying and selling pressure over time
Using Volume:
Volume reveals the strength and sustainability of price moves, aiding confirmation of breakouts, reversals, and trend shifts.
Confirming Breakouts:: Rising volume on breakouts indicates strong participation and higher trend continuation probability. Low-volume breakouts may lack conviction and fail.
Avoiding Low-Volume False Breakouts: Price moves on declining volume suggest weakening momentum and potential trend reversal.
Recognizing Volume Spikes: Sudden volume surges often signal market exhaustion, potentially leading to reversals or corrections as buying or selling pressure wanes.
Spotting Price-Volume Divergences: If price makes new highs or lows while volume declines, it may indicate weakening trend strength and a possible reversal.
Incorporating volume analysis improves decision-making and reduces false signals.
Momentum oscillators identify overbought/oversold conditions, reversals, and trend strength.
Key Momentum Indicators:
Relative Strength Index (RSI): RSI measures overbought or oversold conditions by gauging price movement speed and change on a 0-100 scale Stochastic Oscillator: Compares closing price to price range over a set period
MACD (Moving Average Convergence Divergence): MACD helps identify price trends, momentum, and entry points Rate of Change (ROC): Measures percentage price change over a period
Trading Applications:
Look for divergences between price and momentum (e.g., price makes new high, RSI lower high)
Use oversold RSI (<30) for buying opportunities in uptrends
Use overbought RSI (>70) for shorting opportunities in downtrends
Confirm trend changes with MACD crossovers
Trend-following indicators identify market direction and strength.
Popular Trend Indicators:
Moving Averages (SMA, EMA): Show average price over a period
ADX (Average Directional Index): Measures trend strength regardless of direction
Parabolic SAR: Identifies potential price reversals
Ichimoku Cloud: Comprehensive indicator providing support/resistance, trend direction, and momentum
Indicator Implementation::
Use 20 and 50-day EMAs for medium-term trends
Consider ADX >25 as strong trend
Look for price consistently above/below key MAs
Use Ichimoku Cloud for multiple confirmations
A structured swing trading plan is essential for consistency and reducing emotional decisions. It should specify market selection, timeframes, entry/exit criteria, position sizing, and trading hours. Traders decide which markets or instruments to trade, chart timeframes for analysis, and conditions for trade execution.
Swing Trading Strategy Example:
For instance, a trader might focus on S&P 500 stocks with market caps above $10 billion, using daily charts for trend detection and 4-hour charts for entry timing. A strategy could involve buying pullbacks to the 20-day EMA in strong uptrends, employing a 2:1 reward-to-risk ratio or trailing stops at twice the ATR.
Position sizing aligns with risk management, limiting risk to 1% per trade. Establishing routines— such as weekend watchlist reviews and daily setup analyses— helps maintain preparedness and discipline.
Backtesting enables testing strategies on historical data before risking capital. Simulating trades under past conditions helps evaluate effectiveness, identify weaknesses, and refine methods.
The process includes defining rules, gathering historical data, and applying strategies to past price action. Key metrics include win rate, profit factor, max drawdown, and risk-adjusted returns (Sharpe ratio). This analysis aids refinement while avoiding overfitting, which can cause unrealistic live expectations.
Systematic backtesting builds confidence, improves risk management, and enhances decision-making before live trading.
Keeping a trading journal is vital for performance tracking, as outlined in our guide on cryptocurrency trading.
Journal Entries
Document each trade’s entry/exit prices, position size, and market context. Include screenshots of setups, rationale for entries, and emotional notes. Reviewing successes and mistakes helps identify behavioral patterns and improve decision-making.
Review Process:
A structured review enhances learning, including weekly trade reviews, monthly performance assessments, and quarterly strategy updates based on journal insights. Consistent journaling fosters discipline, execution quality, and long-term profitability.
Success in trading requires skill, knowledge, and practice. TMGM offers comprehensive courses and webinars to develop your expertise. A free demo account with US$100,000 virtual funds lets you practice risk-free and refine strategies.
TMGM also provides trading insights, market news and analysis , plus proprietary tools like Acuity and an Economic Calendar, tailored for traders at all levels. Whether you’re a beginner seeking to learn the


The information provided on this website is of a general nature only and does not constitute personal financial advice. Before acting on any information on this website, you should consider the suitability of the information in relation to your objectives, financial situation and needs. Investing in CFDs and FX Margin Contracts carries significant risks and is not suitable for all investors. You may lose more than your initial deposit. You do not own, or have, any interest in the underlying asset. We recommend that you seek independent advice and ensure you fully understand the risks involved before trading. It is important that you read and consider the disclosure document before you acquire any product listed on the website. The information and advertisements offered on this website are not intended for use by any person in any country or jurisdiction where such use would be contrary to local laws and regulations. The Products and Services offered on this website are not intended for residents of the United States.
TMGM is authorized and regulated in various jurisdictions.
Trademax Australia Limited, trading as TMGM, is regulated by the Australian Securities and Investments Commission (ASIC), AFSL no. 436416 and is located at Level 28, One International Tower, 100 Barangaroo Avenue, 2000 Sydney, NSW Australia.
Email: support@tmgm.com.au
Trademax Global Limited, trading as TMGM, is authorized and regulated by the Vanuatu Financial Services Commission (VFSC), registration number 40356 and registered at 1276, Kumul Highway, Port Vila, Vanuatu, Republic of Vanuatu.
Email: support@tmgm.com
Trademax Global Markets (SE) Limited, trading as TMGM, is authorized and regulated by the Financial Services Authority (FSA) of Seychelles, with license number SD224. The company is registered at Office No 13, Providence Estate ABIS Centre, Mahe, Seychelles.
Email: support@tmgm.com
Trademax Global Markets (International) Pty Ltd, trading as TMGM, is authorized and regulated by the Financial Services Commission, Mauritius (FSC) with license no. GB22201012, and registered at 33, Edith Cavell Street C/o IQ EQ Fund Services (Mauritius) Ltd Port Louis, 11324 Mauritius.
Email: support@tmgm.com
Copyright © TMGM. All rights reserved


