

Apply for a Live
Account
AcademyPartners

Fibonacci retracement is a widely used technical analysis tool that assists traders in pinpointing potential support and resistance zones based on the Fibonacci sequence. It operates by measuring the extent of a price pullback from a recent trend and projecting critical levels—such as 38.2%, 50%, and 61.8%—where price movement may stall or reverse. These levels stem from the golden ratio, a mathematical pattern observed both in nature and financial markets. This guide will detail how Fibonacci retracement functions, its significance, and how to apply it effectively within your trading strategy, whether you are engaged in day trading, swing trading, or spot trading.
23.6%
38.2%
50% (not a Fibonacci number, but widely utilized)
61.8%
78.6%
These ratios are derived from the mathematical relationships within the Fibonacci sequence. For instance, 61.8% represents the inverse of the golden ratio (1 / 1.618), while 38.2% results from dividing a Fibonacci number by the number two places to its right in the sequence.
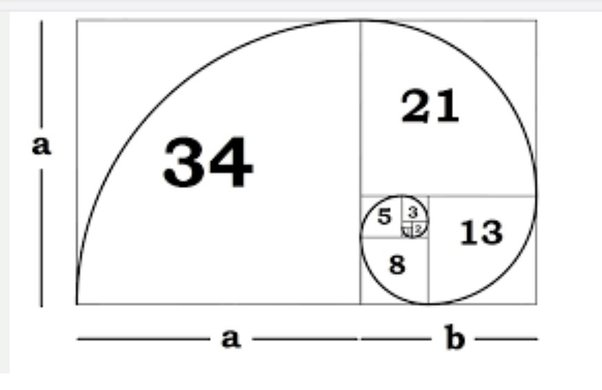
The golden ratio, approximately 1.618 or its inverse 0.618, is intrinsically linked to the Fibonacci sequence. As the sequence advances, the ratio between consecutive numbers converges toward the golden ratio. This mathematical principle appears frequently in nature, from the spiral of a nautilus shell to the pattern of leaves on a stem. Many traders consider it significant in financial markets as well.
The golden ratio (61.8%) is often regarded as the most critical Fibonacci level in trading. Traders across various markets (Forex trading, Cryptocurrency trading, Gold trading and others) closely monitor this level, as price frequently exhibits notable reactions upon reaching it.
Fibonacci retracement is a favored tool for pinpointing potential support and resistance zones during price retracements. It is most effective in trending markets, assisting traders in identifying areas where price may stall, reverse, or continue its trend.
Determine whether the market is in an uptrend or downtrend. This step is crucial because Fibonacci retracement depends on directional price movements to forecast possible reaction zones.
Select a significant swing high and swing low to define the price move. In an uptrend, draw the tool from the low to the high; in a downtrend, draw it from the high to the low. Most trading platforms feature built-in Fibonacci tools that automate this process.
Once plotted, the retracement tool automatically displays common levels such as 23.6%, 38.2%, 50%, 61.8%, and 78.6%. These levels serve as potential support in an uptrend or resistance in a downtrend. Observe price reactions at these zones as potential entry or exit signals.
Enhance your strategy by integrating Fibonacci retracement with other technical tools like trendlines, RSI, MACD, or moving averages. This confluence increases the reliability of trading signals.
Apply Fibonacci levels on various timeframes to identify overlapping zones. Confluence across timeframes often indicates stronger support or resistance, boosting the probability of price reaction.
Begin by practicing on demo or paper trading accounts to accurately identify valid swing highs and lows. Review your trades to refine your approach and build confidence before trading with real capital.
Fibonacci extensions extend beyond the 100% retracement level to help traders identify potential profit-taking targets, such as the 127.2% and 161.8% levels.
Fibonacci fans consist of diagonal lines based on retracement ratios. They are used to identify potential trend continuation zones or dynamic support and resistance levels.
Instead of focusing on price, Fibonacci time zones apply the sequence to time intervals. This technique assists in anticipating potential reversal or breakout points in the future.
Fibonacci clusters occur when multiple retracement or extension levels from different price moves converge in the same area. These clusters often indicate strong price barriers.
Different traders may select different swing points, resulting in variations in the displayed levels. Consistent practice and methodology in choosing points are essential.
Since many traders use Fibonacci levels, price reactions at these points may sometimes occur due to collective market behavior rather than purely technical reasons.
Avoid relying solely on Fibonacci retracement. Incorporate it within a comprehensive trading strategy supported by price action analysis and other technical indicators.
In ranging or highly volatile markets, Fibonacci retracement signals can be unreliable. It performs best in markets exhibiting clear directional trends.
TMGM (Trademax Global Markets) is a reputable broker that equips traders with the necessary tools and platforms to effectively implement Fibonacci retracement strategies. With its robust trading infrastructure, comprehensive educational resources, and dedication to client success, TMGM provides a reliable environment for traders aiming to leverage Fibonacci techniques in their trading.
When trading with TMGM, you can utilize Fibonacci retracement in several ways:
MetaTrader 4 and 5 Integration: TMGM offers MT4 and MT5 platforms with built-in Fibonacci tools, enabling you to easily apply Fibonacci retracement to any chart and customize the level's appearance.
Multi-Asset Application: TMGM provides access to diverse markets, including forex, indices, commodities, and cryptocurrencies. Fibonacci retracement can be applied across all these asset classes, offering a wide range of trading opportunities.
Educational Resources: TMGM provides educational materials and webinars that frequently cover advanced trading techniques, including Fibonacci retracement. Utilize these resources to deepen your understanding and enhance your application of this tool.
Risk Management: Always implement sound risk management when using Fibonacci retracement within your TMGM trading account. Employ stop-loss and take-profit orders aligned with Fibonacci levels to manage exposure effectively.
Demo Account Practice: Before applying Fibonacci retracement in live trading, utilize TMGM'’s demo account feature to practice and refine your strategy without risking real funds.
Leveraging the power of Fibonacci retracement alongside TMGM'’s robust trading infrastructure can significantly enhance your trading strategy and decision-making process. Nonetheless, always remember that no trading tool is infallible, and it's essential to integrate Fibonacci retracement within a comprehensive trading plan that includes thorough market analysis and disciplined risk management.


The information provided on this website is of a general nature only and does not constitute personal financial advice. Before acting on any information on this website, you should consider the suitability of the information in relation to your objectives, financial situation and needs. Investing in CFDs and FX Margin Contracts carries significant risks and is not suitable for all investors. You may lose more than your initial deposit. You do not own, or have, any interest in the underlying asset. We recommend that you seek independent advice and ensure you fully understand the risks involved before trading. It is important that you read and consider the disclosure document before you acquire any product listed on the website. The information and advertisements offered on this website are not intended for use by any person in any country or jurisdiction where such use would be contrary to local laws and regulations. The Products and Services offered on this website are not intended for residents of the United States.
TMGM is authorized and regulated in various jurisdictions.
Trademax Australia Limited, trading as TMGM, is regulated by the Australian Securities and Investments Commission (ASIC), AFSL no. 436416 and is located at Level 28, One International Tower, 100 Barangaroo Avenue, 2000 Sydney, NSW Australia.
Email: support@tmgm.com.au
Trademax Global Limited, trading as TMGM, is authorized and regulated by the Vanuatu Financial Services Commission (VFSC), registration number 40356 and registered at 1276, Kumul Highway, Port Vila, Vanuatu, Republic of Vanuatu.
Email: support@tmgm.com
Trademax Global Markets (SE) Limited, trading as TMGM, is authorized and regulated by the Financial Services Authority (FSA) of Seychelles, with license number SD224. The company is registered at Office No 13, Providence Estate ABIS Centre, Mahe, Seychelles.
Email: support@tmgm.com
Trademax Global Markets (International) Pty Ltd, trading as TMGM, is authorized and regulated by the Financial Services Commission, Mauritius (FSC) with license no. GB22201012, and registered at 33, Edith Cavell Street C/o IQ EQ Fund Services (Mauritius) Ltd Port Louis, 11324 Mauritius.
Email: support@tmgm.com
Copyright © TMGM. All rights reserved


