


Apply for a Live
Account
AcademyPartners

Day trading is a high-intensity trading approach that entails completing all positions within the same trading day, enabling traders to profit from intraday price fluctuations while fully avoiding overnight exposure. A robust online trading platform should provide key features such as: Rapid Order Execution, Leverage Options, Advanced Analytical Tools, and Low or Zero Commission Fees. Many novice traders underestimate the complexity involved, resulting in high failure rates. Achieving success requires comprehensive education, a well-defined trading strategy, rigorous risk management, and disciplined execution.
Key Takeaways
This guide covers profitable CFD trading strategies, technical analysis, and risk management techniques used by experienced traders. It assists both novices and seasoned traders in refining their approach for consistent profitability. Before applying any CFD day trading strategy, it's critical to understand the structure of the market you're trading. Different markets—stocks, forex, futures, or cryptocurrencies—exhibit distinct characteristics:
Stock Markets: Influenced by company fundamentals, sector trends, and overall market sentiment
Forex Markets: Driven by macroeconomic indicators, interest rate differentials, and geopolitical developments
Futures Markets: Affected by supply and demand dynamics, seasonal factors, and underlying spot markets
Cryptocurrency Markets: Impacted by technological advancements, regulatory updates, and adoption rates
Understanding these structural differences helps determine which strategies are most effective under specific market conditions.
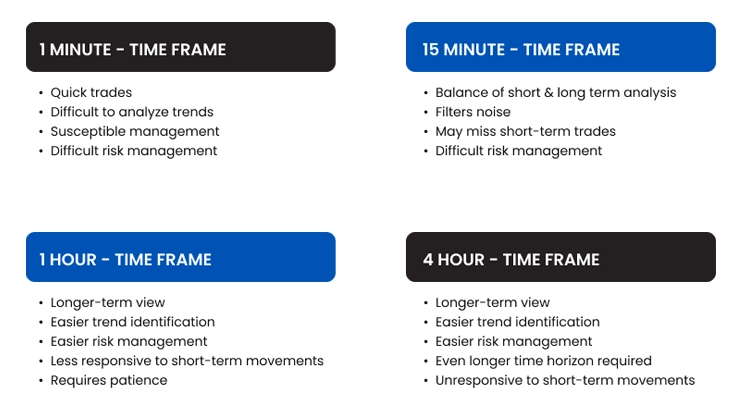
Day traders generally focus on shorter time frames, but successful traders often employ multi-timeframe analysis:
1-minute and 5-minute charts: Used for precise entry and exit timing
15-minute and 30-minute charts: Assist in identifying intraday trends and key support/resistance zones
1-hour and 4-hour charts: Provide context for the broader intraday trend
Daily charts: Offer perspective on significant levels and overall market direction
Utilizing multiple time frames delivers a more comprehensive market view and helps filter out false signals common in lower time frames.
Figure 1: Informational chart titled "Day Trading Time Frames", illustrating various time frames used in day trading and their respective benefits and challenges
Core Risk-Management Principles for Traders
Before delving into specific strategies, it's essential to establish sound risk management principles. A fundamental rule is to never risk more than 1-2% of your trading capital on any single trade, ensuring losses remain controlled. Maintaining a risk-to-reward ratio of at least 1:1.5, ideally 1:2 or higher, helps optimize returns relative to risk.
Implementing hard stop-loss orders is critical to protect against unexpected market volatility and limit drawdowns. Additionally, monitoring performance metrics enables traders to identify strengths and weaknesses for ongoing improvement. These fundamentals underpin profitable and sustainable day trading strategies.
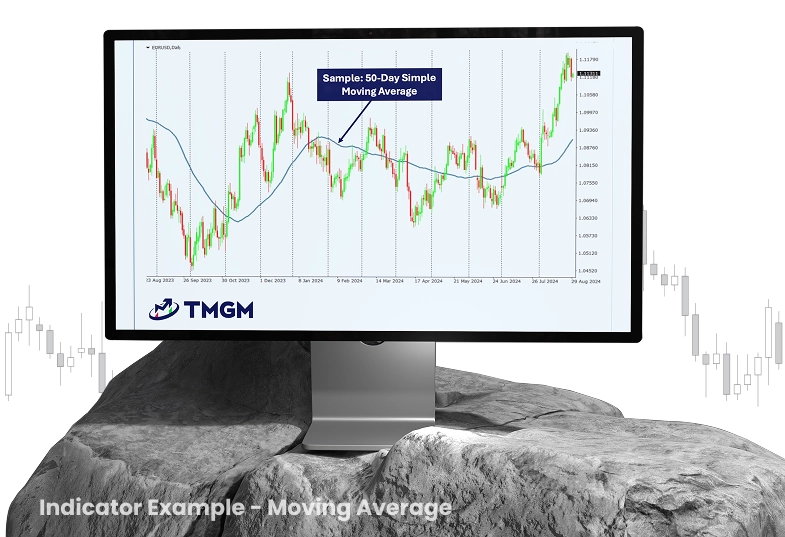
Trend following remains one of the most dependable day trading approaches, based on the premise that prices tend to continue moving in their current direction until a significant reversal occurs.
Figure 2: Technical analysis chart displaying the EUR/USD currency pair on a daily timeframe with a 50-day Simple Moving Average (SMA) applied
This strategy employs moving averages to determine trend direction and identify entry points:
Plot two moving averages—typically a 20-period Exponential Moving Average (EMA) and a 50-period EMA
Enter long positions when the shorter MA crosses above the longer MA
Enter short positions when the shorter MA crosses below the longer MA
Set stop-loss orders below recent swing lows (for long trades) or above recent swing highs (for short trades)
Take profits at predetermined levels or when moving averages indicate a potential trend reversal
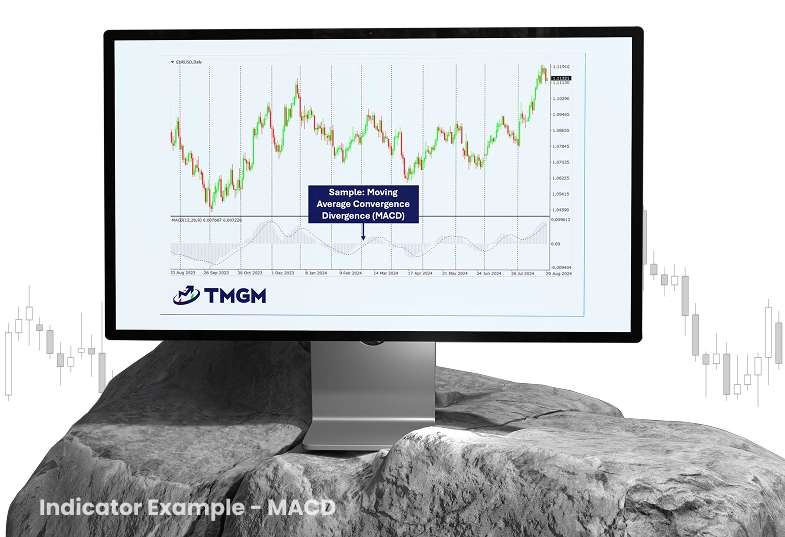
MACD Trend-Trading: Day Trading Tool
Figure 2: Technical analysis chart illustrating the use of the Moving Average Convergence Divergence (MACD) indicator on the EUR/USD daily chart
The Moving Average Convergence Divergence (MACD) indicator helps gauge trend strength and identify potential reversals:
Enter long positions when the MACD line crosses above the signal line during an uptrend
Enter short positions when the MACD line crosses below the signal line during a downtrend
Confirm signals with supplementary indicators such as RSI or volume
Exit trades when the MACD line crosses back in the opposite direction
Reversal strategies aim to identify the onset of new trends as market direction changes.
Oversold/Overbought Reversals
Figure 3: Technical analysis chart demonstrating overbought and oversold conditions, commonly identified using momentum indicators like the Relative Strength Index (RSI) or Stochastic Oscillator.
This approach utilizes momentum oscillators such as Relative Strength Index (RSI) to pinpoint potential reversal zones:
Identify extreme overbought conditions (RSI above 70) or oversold conditions (RSI below 30)
Look for divergence between price action and oscillator readings (price makes new highs/lows while the indicator does not)'
Wait for confirmation candlestick patterns (such as engulfing patterns, hammer, or shooting star)
Enter positions with tight stop-loss orders placed beyond the extreme price point
Take profits at significant support/resistance levels or when momentum diminishes
Double-Top & and Double-Bottom Formations Explained
This pattern-based strategy targets reversals at critical technical levels:
Identify securities that have tested the same support or resistance level twice
Enter short positions when the price breaks below the "neckline" following a double top pattern
Enter long positions when the price breaks above the "neckline" following a double bottom pattern
Place stop-loss orders above or below the pattern structure
Set profit targets equal to the height of the pattern
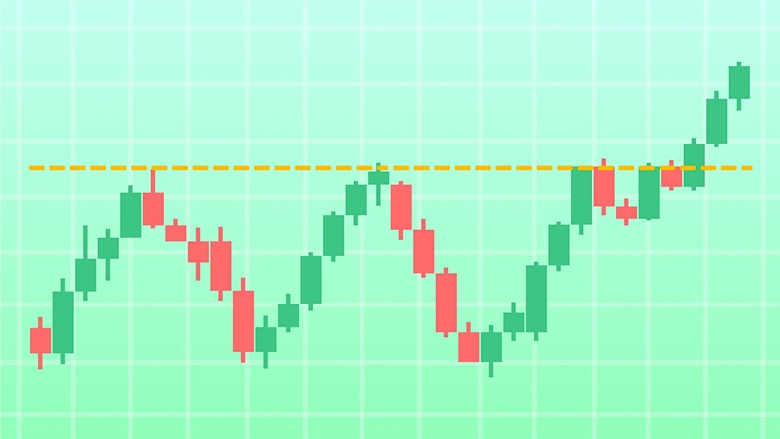
Figure 4: Depicts a resistance breakout, a fundamental concept in technical analysis used to identify potential trend reversals or continuations
Breakout strategies exploit significant price moves when the market breaches established support or resistance levels.
Range-Breakout Strategy: Capturing Early Momentum
Identify markets trading within a defined range (bounded by clear support and resistance)
Wait for price to approach range boundaries accompanied by rising volume
Enter long positions on a breakout above resistance or short positions on a breakdown below support
Place stop-loss orders just inside the broken range
Set profit targets equal to the height of the range
Opening-Range Breakout for Intraday Gains
This strategy leverages the initial trading range established during the market open:
Define the high and low of the first 30 minutes (or first hour) of trading
Enter long positions when price breaks above the opening range high
Enter short positions when price breaks below the opening range low
Place stop-loss orders at the opposite end of the range
Take profits at key support/resistance levels or employ trailing stops
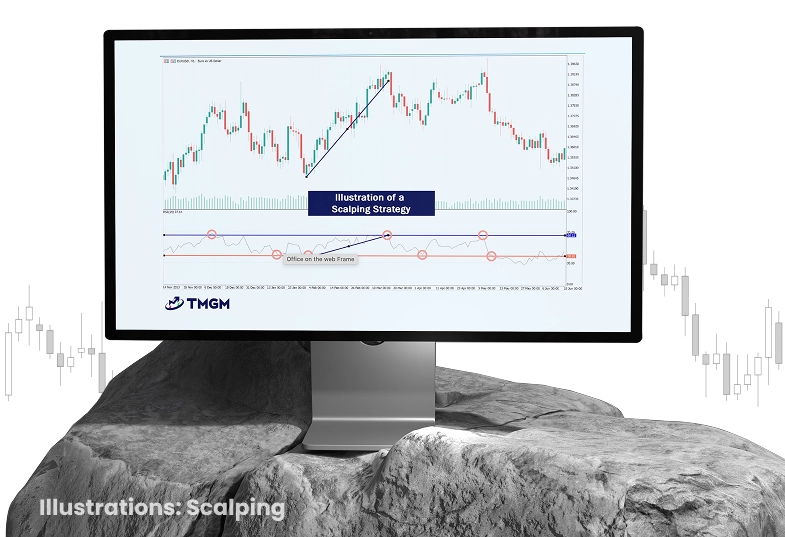
Figure 5: Demonstrates a scalping strategy applied to a EUR/USD forex chart on an H1 (hourly) timeframe
Scalping involves executing numerous trades within a day, targeting small price movements for quick profits.
Bid-Ask Spread Scalping Techniques
This approach is especially effective in forex and futures markets:
Focus on assets with tight bid-ask spreads
Enter trades aligned with the immediate short-term trend
Aim for profits of 5-10 pips or ticks
Use tight stop-losses, typically 2-5 pips or ticks
Exit positions swiftly, usually within minutes
Order-Flow Scalping: Analyzing Market Depth
This advanced method utilizes order flow analysis to detect institutional buying and selling activity:
Use time and sales data and/or depth of market (DOM) information
Identify large orders or imbalances between buy and sell volumes
Enter trades in the direction of dominant order flow
Exit when order flow imbalance diminishes
Maintain strict risk management with predefined stop-losses
Gap trading exploits price gaps occurring between the previous market close and the next day's open.
Gap-Fill Strategy: Trading Overnight Gaps
Identify stocks or futures opening with a significant gap relative to the prior day's close.
Analyze the gap type (common gap, breakaway gap, runaway gap, or exhaustion gap)
For common gaps, enter trades anticipating the gap will close (price returns to previous close)
For breakaway or runaway gaps, enter trades in the direction of the gap
Place stop-loss orders beyond key support or resistance levels
Take profits when the gap fills or at predefined price targets
Successful day traders commonly use a combination of the following technical indicators:
Moving Averages (Simple Moving Average - SMA, Exponential Moving Average - EMA): Identify trend direction and key support/resistance levels
Using RSI for Overbought/Oversold Signals: Measure overbought and oversold market conditions
Stochastic Oscillator for Entry Timing: Identify potential reversal points
Bollinger Bands for Volatility Breakouts: Assess volatility and potential price targets
VWAP (Volume-Weighted Average Price) Tactics: Serve as a benchmark for intraday price action
ATR-Based Stops: Adapting to Volatility: Use Average True Range (ATR) to set stop-loss distances based on market volatility
The key is to avoid overloading with too many indicators; instead, select complementary tools that address different facets of price behavior.
Recognizing high-probability chart patterns significantly enhances trading performance by providing insights into potential price trajectories. Continuation patterns such as flags, pennants, and triangles suggest the prevailing trend will likely continue. Reversal patterns, including head and shoulders, double tops/bottoms, and island reversals, indicate possible trend reversals and critical market turning points.
Additionally, candlestick patterns like engulfing patterns, doji, hammer, and shooting star offer valuable clues about market sentiment and momentum shifts. Each pattern assists traders in identifying optimal entry and exit points while providing logical locations for stop-loss and take-profit orders, thereby improving risk management and overall strategy execution.
Volume confirms price action and offers critical insights:
Spotting Volume Spikes for Confirmation: Often signal potential reversals or breakouts
Identifying Volume Divergence to Validate Trends: Occurs when price makes new highs or lows but volume does not confirm'
Leveraging Relative Volume Effectively: Comparing current volume to average volume highlights unusual trading activity
Day traders should always corroborate price signals with corresponding volume activity to increase trade probability.
Emotional discipline is a critical differentiator between profitable and unsuccessful day traders. Fear can cause premature exits or hesitation to enter valid setups. Greed may lead to holding positions too long or overleveraging. Revenge trading—attempting to recover losses with high-risk trades—is particularly detrimental. Successful traders develop systematic methods to manage these emotional challenges and maintain discipline.
A proper trading mindset is essential for long-term success. Probability thinking helps traders accept that no single trade guarantees profit. Process orientation shifts focus from immediate outcomes to consistent strategy execution. Emotional detachment enables unbiased decision-making. Continuous learning ensures each trade contributes to skill development and strategy refinement.
Discipline entails strictly adhering to a trading plan and risk management rules without exceptions. Traders should only take trades that meet predefined criteria. Maintaining detailed trading journals facilitates performance tracking and highlights areas for improvement. Regular trade reviews help ensure adherence to strategy and enable necessary adjustments to optimize results.
Figure 6: Psychological aspects of successful trading outlining seven key principles traders should master.
A comprehensive trading plan is vital for maintaining consistency and structure in day trading. It should specify the markets and time frames to trade, along with clear entry and exit criteria for trade setups. Position sizing guidelines manage risk, while risk management rules protect capital. Establishing a trading schedule and routine fosters discipline, and a performance review process supports continuous strategy enhancement. The plan should be documented clearly enough for another trader to execute it precisely.
Before deploying real capital, traders must backtest strategies to assess performance and reliability. This involves applying strategy rules to historical price data for the targeted markets.
Recording hypothetical trades and outcomes provides insights into profitability, while metrics such as win rate, profit factor, and maximum drawdown help evaluate risk and consistency. Based on these results, traders can refine strategies to improve effectiveness prior to live trading.
After backtesting, traders should conduct real-time simulated trading (paper trading) to evaluate execution quality, emotional responses, and practical challenges not evident during backtesting.
Making final adjustments during this phase helps refine the system. When transitioning to live trading, starting with small position sizes minimizes risk while building confidence in real market conditions.
Risk management is the cornerstone of successful day trading. Even the best setups can result in losses without a solid risk strategy. Here’s how to manage risk effectively:
Position sizing determines how much capital is exposed per trade.
Risk per trade: Limit to 1-2% of your total account balance per trade.
Position-Size Formula: Position Size = Risk Capital ÷ Stop-Loss Distance in Pips (or Points)
Managing Drawdowns to Stay in the Game: For example, if your account is $20,000 and you risk 1% per trade ($200), with a stop-loss of 20 pips, your position size should be $200 ÷ ÷ 20 pips = $10 per pip.
Leverage Caution - Using Margin Responsibly: Higher leverage increases market exposure. Always align leverage with your risk tolerance.
A stop-loss order limits potential losses if the market moves against your position.
Types of stop-losses:
Fixed stop-loss: A predetermined percentage (e.g., 1% of capital).
ATR-based stop-loss: Uses the Average True Range (ATR) to adjust stop distances according to market volatility.
Technical stop-loss: Placed at support/resistance levels, trendlines, or moving averages.
Trailing stop-loss: Moves with the trade as it becomes profitable, locking in gains while limiting downside risk.
Example:
Buying at $100 with a 2% stop-loss → Stop set at $98.
In forex, if ATR is 15 pips, the stop-loss could be 1.5 × × ATR = 22.5 pips.
A drawdown represents a decline in account equity following a series of losing trades.
Maximum drawdown limit: Cease trading if you reach a 5-10% monthly drawdown.
Risk-to-reward ratio: Target at least a 1:2 risk-to-reward (risking $1 to gain $2).
Reducing risk during losing streaks:
If losses persist, halve your risk per trade.
Reassess strategy——are market conditions unfavorable, or is execution flawed?
Example:
A trader begins with $10,000 and incurs a $1,000 loss (10% drawdown).
They reduce position sizes and concentrate on higher-probability setups.
Implementing profitable day trading strategies requires expertise and the right trading environment. TMGM provides traders with an optimal platform to execute these strategies efficiently:
Lightning-Fast Execution: Execute your day trading strategies with minimal slippage
Competitive Spreads for Cost Efficiency: Maximize profit potential with tight spreads across all asset classes
Advanced Trading Platforms: Access professional-grade charting, indicators, and execution tools
Multi-Asset Trading: Apply your strategies across forex, equities, indices, commodities, and cryptocurrencies
Top Risk-Management Tools for Day Traders: Utilize guaranteed stop-loss orders and other advanced risk management features
Best Educational Resources for Beginners: Enhance your trading skills with TMGM'’s comprehensive educational offerings
Leverage 24/5 Expert Support from TMGM: Receive assistance anytime from experienced trading professionals
Whether you focus on trend following, breakout trading, or scalping, TMGM delivers professional infrastructure, advanced trading tools, and our trading academy to help you execute your day trading plan with precision.
Ready to implement these profitable day trading strategies? Open an account with TMGM today and experience how a professional trading environment can enhance your trading outcomes.


The information provided on this website is of a general nature only and does not constitute personal financial advice. Before acting on any information on this website, you should consider the suitability of the information in relation to your objectives, financial situation and needs. Investing in CFDs and FX Margin Contracts carries significant risks and is not suitable for all investors. You may lose more than your initial deposit. You do not own, or have, any interest in the underlying asset. We recommend that you seek independent advice and ensure you fully understand the risks involved before trading. It is important that you read and consider the disclosure document before you acquire any product listed on the website. The information and advertisements offered on this website are not intended for use by any person in any country or jurisdiction where such use would be contrary to local laws and regulations. The Products and Services offered on this website are not intended for residents of the United States.
TMGM is authorized and regulated in various jurisdictions.
Trademax Australia Limited, trading as TMGM, is regulated by the Australian Securities and Investments Commission (ASIC), AFSL no. 436416 and is located at Level 28, One International Tower, 100 Barangaroo Avenue, 2000 Sydney, NSW Australia.
Email: support@tmgm.com.au
Trademax Global Limited, trading as TMGM, is authorized and regulated by the Vanuatu Financial Services Commission (VFSC), registration number 40356 and registered at 1276, Kumul Highway, Port Vila, Vanuatu, Republic of Vanuatu.
Email: support@tmgm.com
Trademax Global Markets (SE) Limited, trading as TMGM, is authorized and regulated by the Financial Services Authority (FSA) of Seychelles, with license number SD224. The company is registered at Office No 13, Providence Estate ABIS Centre, Mahe, Seychelles.
Email: support@tmgm.com
Trademax Global Markets (International) Pty Ltd, trading as TMGM, is authorized and regulated by the Financial Services Commission, Mauritius (FSC) with license no. GB22201012, and registered at 33, Edith Cavell Street C/o IQ EQ Fund Services (Mauritius) Ltd Port Louis, 11324 Mauritius.
Email: support@tmgm.com
Copyright © TMGM. All rights reserved


